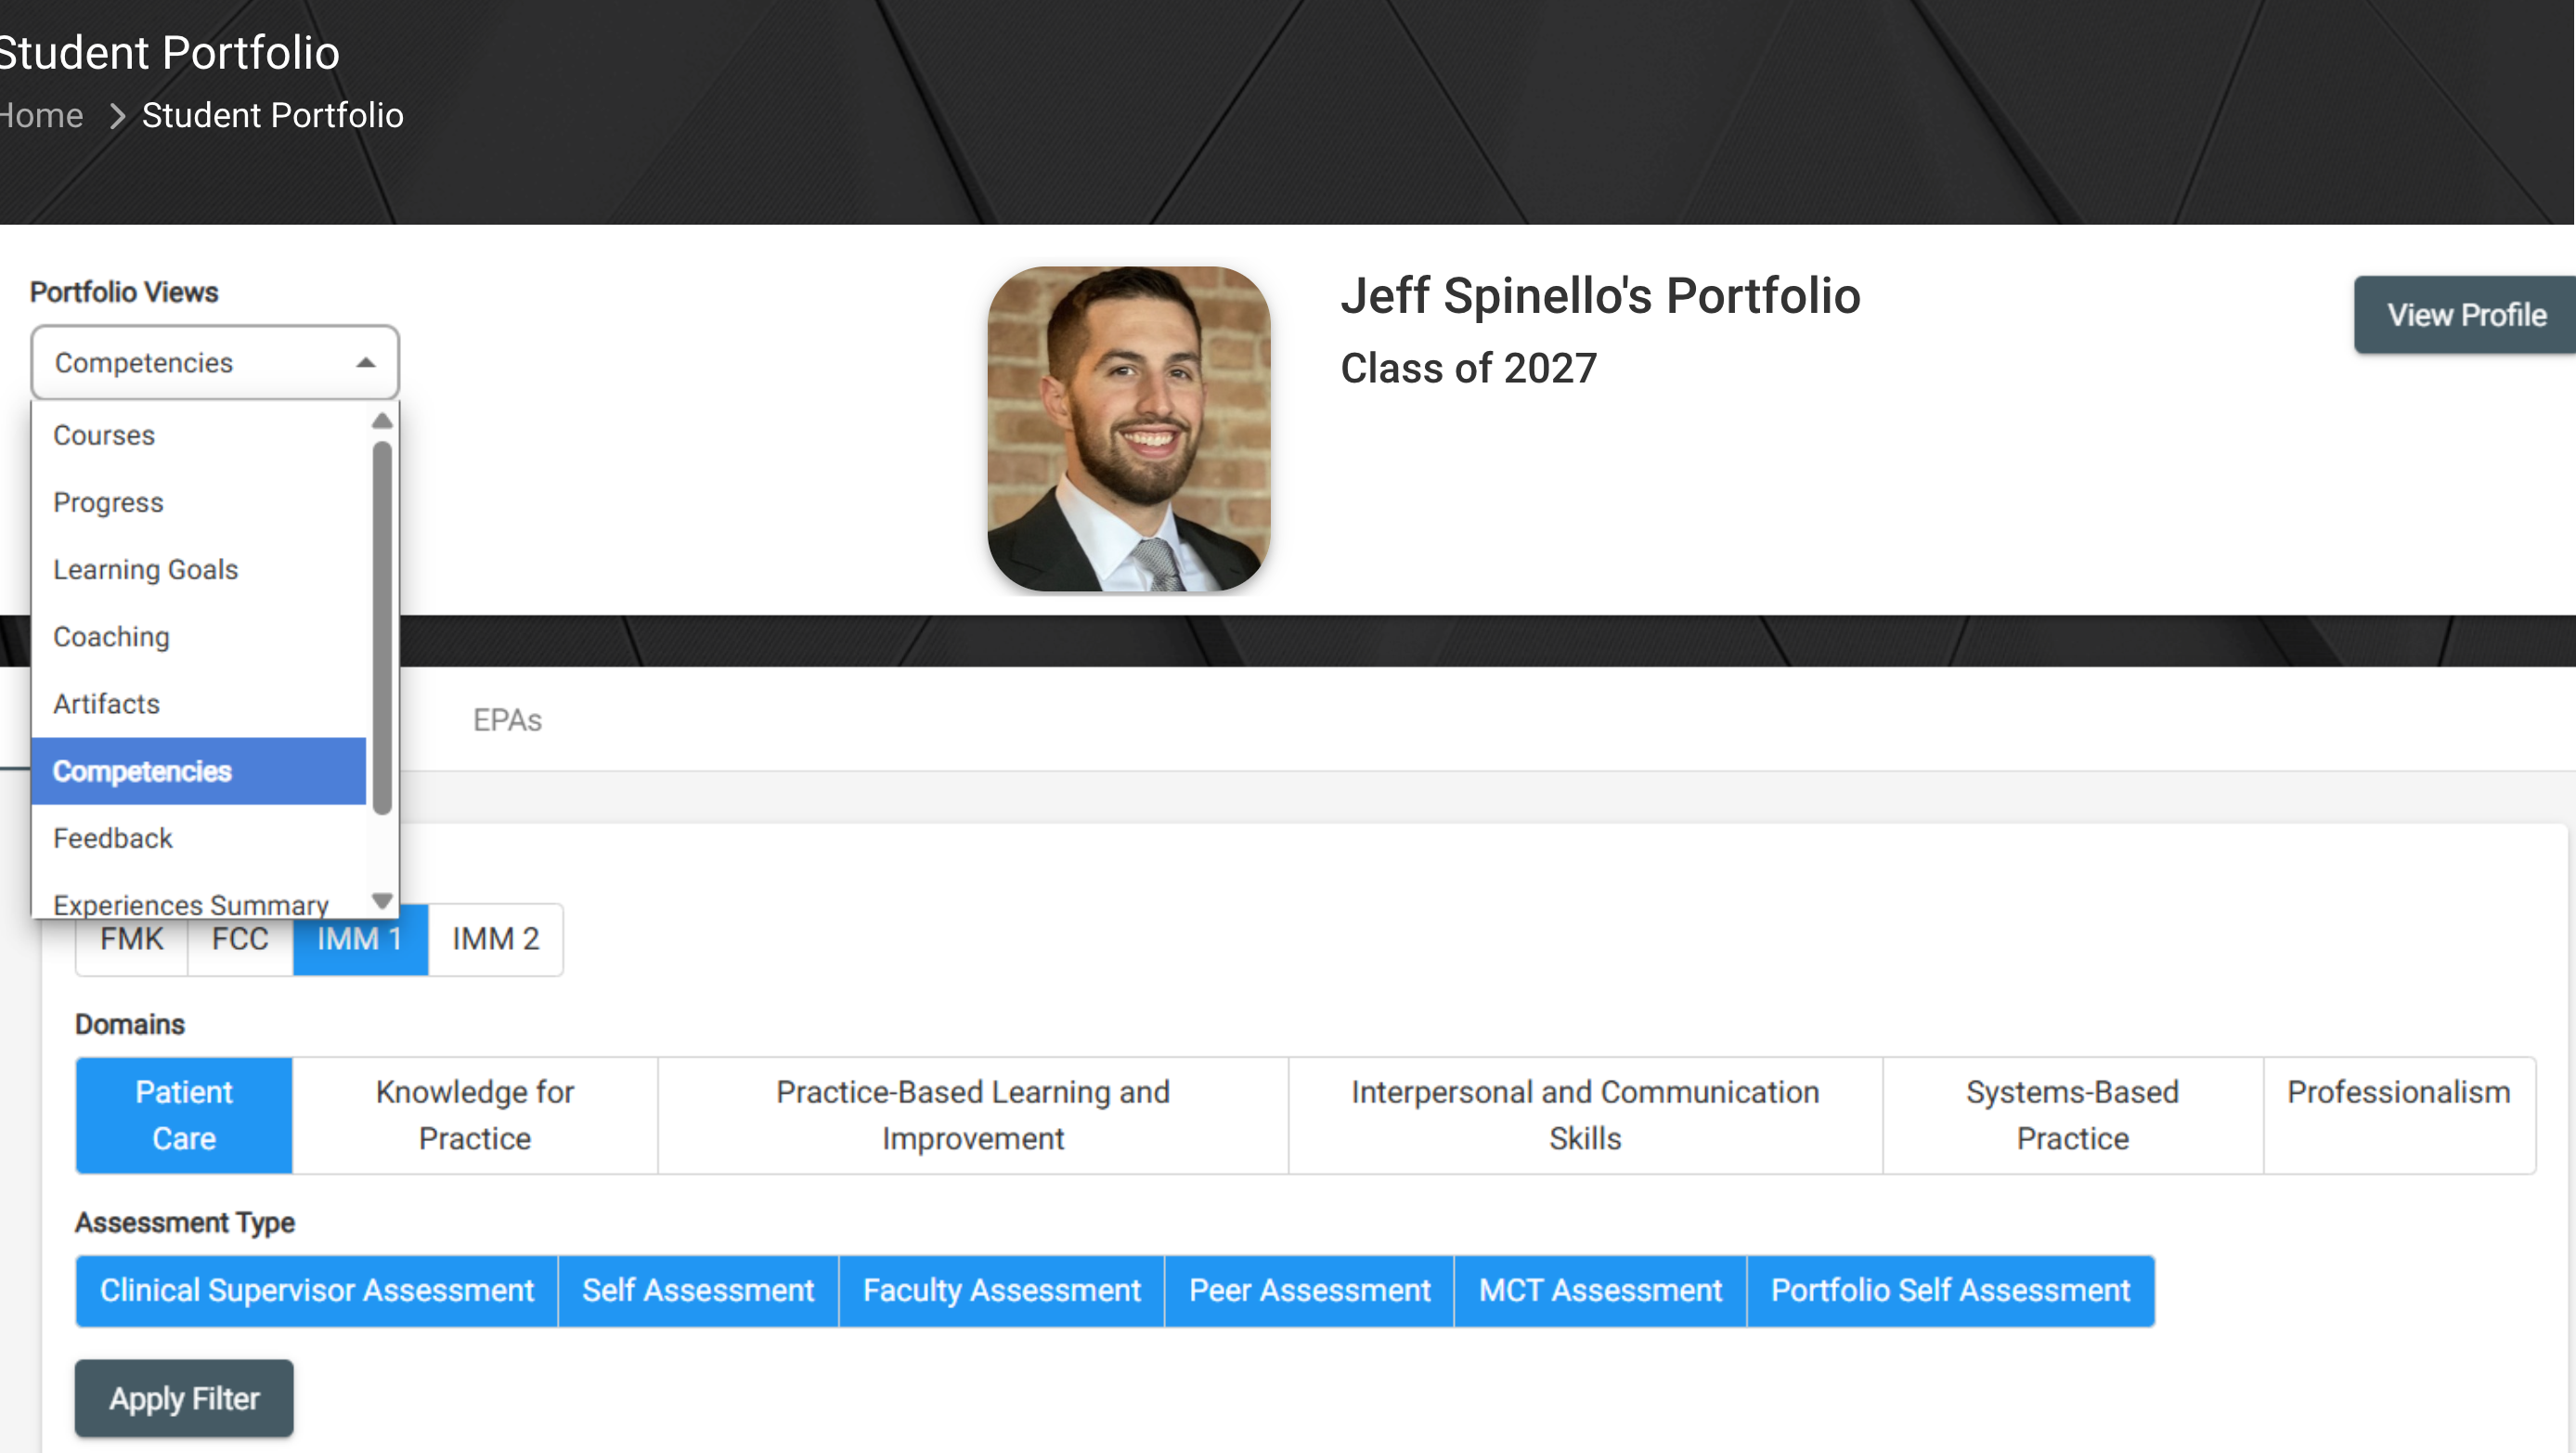
Students can view how they are performing on each Competency across all Assessments in the Competencies dropdown view in the Student Portfolio. This will be display in a Scatterplot for each Competency within a Domain.
You can select which Phase, Domain, and Assessment Type you wish to view. Of these only Assessment type can have multiple selections chosen at the same time, but you may wish to narrow down the selections to see fewer data points or specific types of assessments. Once you make your selections, you must click Apply Filter.

Once you have narrowed your search and selected Apply Filter you will see your results appear in the scatterplots below. The Date of the assessment will be plotted on the x-axis, the score on the y-axis, and a legend to interpret the colored dots on the right side.

You will be able to hover over the data point to view additional information, including the Assessment Name, the Assessor Name, the Score, and the date the assessment was completed. If you click on the data point, it will open up the applicable assessment.


These scatterplots can be used to gauge how you are performing across all Competencies and across each assessment type. They can also be used to guide the conversation with your Portfolio Coaches.